Wednesday, October 19, 2011

Surprise!! Prices Have Been Falling For Years

I wonder how many people in countries like Switzerland, Brazil, Canada, Russia, and China, and the United States would be surprised to learn that prices of products and services in their countries have become much less expensive over the years.
Say what? You must be crazy, you say! Prices are rising way too fast!
Yes, most citizens see their purchases as becoming more expensive when, in actuality, things are becoming less expensive. Of course, the paradox is that although nominal prices (the actual price tag) are, in fact, increasing, nominal income (the average wage or salary) has been growing faster. This is a topic that in economics is called “real income” or a measurement that compares a nation’s income growth relative to the growth in prices that the same income buys.
Let’s take some specific facts for the United States:
In the United States real median household income grew from $41,318 to $50,811 from 1970 through 2006 for a total percentage gain of 23% (source: Pew Research Center). Both of the aforementioned median household incomes are stated in 2008 or current dollars which makes the comparison valid. Median household income is an attempt to quantify the progress that the “middle American” family or typical family has made. So, in short, the median household in America can buy 23% more with their income today than they could in 1970. In other words, relative prices are lower to income.
If we look at the same United States income data over the same period for real average household income, there is real income growth of nearly 60%. The higher growth (60%) in real incomes for the average household versus the median (middle) growth rate (23%) is explained by the fact that much of the growth in United States’ real incomes has accrued disproportionately to the college educated & entrepreneurs driving up real income growth rates much faster for the average than the median or middle household. (Hint: continue your education!)
Now let’s get back to the main premise of the title of this blog and the opening assertion that prices are lower than ever. What we are really saying is that you have to benchmark price increases to income increases to really understand whether things are becoming more expensive. The vast majority of products & services are cheaper today in all nations than they have ever been before, which helps explain, excluding the effects of the current recession, why more citizens than ever before can afford to own their own houses, drive more and better cars, and are likely to have cable, cell phones, and computers. The reason we are led to believe differently is because we are victims of our own human nature, which often causes us to focus on the problem areas (rising prices) and not the benefits (incomes that are rising faster). Most citizens’ focus expands out to the last dollar of their incomes and they quickly notice those select products that are rising faster than others like health care, gasoline prices, and education! Hey, even gasoline prices are not at an all relative price high. If gasoline prices in the United States are restated for inflation, or set to comparable 2009 dollars, they are $2.60 per gallon today vs. $3.17 in 1981 and $3.50 in 1918!
Now, you may say to yourself that statistics can lie or mislead and you are sure in your gut that things are getting more expensive relatively. You can try to validate that incorrect “gut feeling” by examining whether your country’s middle class is enjoying less or more products and services. “Real income” really is just a measurement of the quantity and quality of products and services that you have. For example, the average American household has larger homes, more cars, more air conditioning, more gadgets, and better healthcare & prescription drugs than, say, 20 years ago.
But let’s end this blog with a concern. Although everything noted above is accurate, the pace of real income growth has been relatively slow over the last 10 years, especially for the middle class in the United States. Most of that growth in real income mentioned above has occurred up until this current decade. For the last 10 years, median family income growth in the U.S. has been very small and the average income growth has been higher but below the U.S. historical experience. There are many reasons for this slowdown in real income growth, but three big reasons are that
  1. the U.S. has now had two recessions this decade (2001 and 2007-current, versus our historical average of only 1 per decade), and
  2. energy and health care prices have risen much faster, and
  3. foreign labor competition and technology advancement has kept the uneducated/unskilled U.S. workers real income relatively stagnant. More than ever before, a good education is the ticket to your economic future!
Discussion Questions:
  1. Inflation is bad, right? Well, what if average prices rise by 2% a year but average incomes rise by 3%. What happens to real income in this situation? Is the average household better or worse off in such a scenario?
  2. How have trade and globalization contributed to rising real wages in America and Swizerland?
  3. How have trade and globalization contributed to falling nominal wages in America and Switzerland?
  4. How do improvments in technology contribute to rising real wages in both developed and developing economies? What about health and education?
  5. What types of policies can government pursue to help raise the real wages of the nation’s workers?

GDP Made Simple

Just a few weeks ago, the U.S. Government’s Commerce Department provided its first estimate of the country’s 3rd quarter (July-September 2009) gross domestic product or GDP, announcing an estimated annualized quarter over quarter growth of 3.5%. GDP reports are of special interest to countries since they provide an important macroeconomic measurement of how much an economy’s goods & services supply and income has grown, or recessed, compared to the last three calendar months.
Let me try and make the concept of GDP easy to understand and why it is considered perhaps the most important, single macroeconomic measurement.
GDP is simply a calculation that measures the market value (final price) of all the final goods and services produced within the borders of our country. Thus, U.S. GDP includes Toyotas produced in Alabama but excludes Cadillac’s made in Canada. GDP includes all U.S. exports but excludes all U.S. imports since imports, by definition, imports are produced in some other country and are a more direct employment benefit of the foreign country’s GDP.
If you think about it, ultimately our country’s economic satisfaction is best measured by the goods and services that are produced and that we have access to, which is why GDP is the measurement that is synonymous with “economic growth” or growth in goods & services for its citizens. In addition, rising GDP (more goods and services) is the ultimate economic goal of any economy which can best be accomplished through the means of the two other key macroeconomic measurements of employment and productivity, which are not the subject of this particular blog.
Let’s describe how the GDP calculation is made. Each quarter, the Government compares the final value of the domestic goods produced and services rendered in the current quarter to the final value of the goods produced and services rendered in the previous quarter. The calculation then takes the percentage gain, current quarter versus previous quarter, and annualizes the percentage. The comparison is always restated for inflation so that the figures are comparable from one period to the next. For purists, we call this “real GDP” which is the only GDP reported by the media, even though the word “real” is almost always dropped to avoid confusion with the average citizen. For example, the third quarter 2009 U.S. GDP report highlighted a 3.5% GDP annualized growth rate. This means that the second quarter final value of goods and services produced was approximately .87% or 3.5%/4.
Now let me get to my favorite point on GDP, which even many economists lose sight of. GDP growth is precisely the same as income growth! For example, in the second quarter of 2009 we can say that incomes for American households and American citizens grew by 3.5% restated for inflation. Said another way, our country’s purchasing power grew by 3.5% which represents the income to produce the increasing supply of goods and services. You probably never thought about it this way but every time you purchase something, every dollar you spend is going to someone as income, whether it is the workers as wages or benefits, the landlords as rent, a bank that has made a loan as interest income, or to the owners of the business as profits. I tell my students that Real GDP = Real Income and the only question is how that real income is dispersed among owners (profits), workers (employee wages and benefits), lenders (interest), and lessors (rent). Many citizens are unaware that the Government calculates GDP both in terms of the final market value of the goods and services PRODUCED (the “expenditure method”, which is the version that the media uses, as well as how that same production value under the “expenditure method” translates to higher incomes in a GDP version called the “income method”.
I find the preceding paragraph, GDP = Income, to be a break through moment for a lot of citizens, or first time economic students, in truly understanding the value of the GDP measurement. It is easier for most to think in terms percentage growth in income in lieu of a fuzzier wording like GDP percentage growth. Most citizens are surprised to find that our national incomes or GDP, restated for inflation, increased by 17.4% from 2000 – 2007, just prior to the onset of this current recession. This 7-year growth rate in GDP or incomes still equates to a below average historical average performance. More specifically, over the last 7 years our average annual GDP or income growth rate was only 2.2% versus our historical average growth rate of 3.2%. However, the final point of caution is that the GDP or income growth rate is a collective average, thus the growth in GDP or incomes does not indicate how those income gains are accruing to the various socioeconomic classes or professions. That is also a topic of a future blog on “income distribution” or equality.
Discussion Questions:
  1. Have you ever thought about substituting the word “income” for “GDP” to understand GDP more simply? Why are the concepts of income and GDP inter-changeable?
  2. Which four groups earn the income generated by the production of goods and services?
  3. Although GDP has still risen this decade, despite the current severe recession, many analyses show that our nation’s middle class has made virtually no real income gains this decade. How could this be so if GDP = Income and our GDP has grown this decade?

Booms and Busts - The Business Cycle

The business cycle is an economic phenomenon which describes changes in the level of economic output compared to a long run average. A simple set of data illustrating the business cycle is shown below. The level of Real GDP in most countries increased by a positive rate each year from 2000 – 2008, before the Global Financial Crisis caused the most significant recession and then recovery in recent history.

In Macroeconomics we can model changes in the level of economic activity using the Aggregate Demand and Aggregate Supply model. This theoretical idea is shown on the following diagram, which explains the link between the business cycle and the level of aggregate demand and aggregate supply in the economy.
When the actual GDP line is above the potential GDP line the economy is said to have a positive output gap as at the peak point. Aggregate Demand exceeds the potential capacity thus shortages occur and prices rise (inflation) also called an inflationary gap. Factors of production such as labor, land and capital are fixed in the short run, and wages can not change. Therefore the inflationary gap will remain in the short run.

When the actual GDP line is below the potential GDP line the economy has a negative output gap as in a recession. At this point there is spare capacity, higher then average unemployment leading to less inflationary pressures in the aggregate economy.  Also called a recessionary gap. We can relate this concept back to the Real GDP data, which explains a dramatic fall in the level of economic activity in 2009.
Each of these two simple scenarios is caused by changes in Aggregate Demand. As we studies last week, changes in Aggregate Demand can be caused by a variety of factors which influence each component
Components of Aggregate Demand (AD)
C – Consumer Spending
I – Investment
G – Government Spending
(X-M) – Net Export Receipts
The two following videos highlight changes to the level of Aggregate Demand and the resulting inflationary and recessionary gaps. The first video explains how the Chinese government is boosting aggregate demand by increasing government spending and investment. It is a likely response to boost economic activity, and to reduce unemployment.
The second video is a quick look at the UK government budget. A government budget explains the countries spending and taxation decisions for the coming year. The UK was forced to reduce government spending due to the countries very high levels of public debt. The UK has been forced to borrow money to pay for current spending, which increases the nations debt to the rest of the world.

Discussion Questions and Activities:

  1. Explain any changes to Aggregate Demand that would result in an inflationary gap occurring?
  2. When a country is experiencing an inflationary gap, what happens to price levels and the level of unemployment?
  3. Video 1: What are the impacts on level of economic activity due to the government investment? Evaluate if you think this is an effective form of investment.
  4. Video 2: The UK government is planning to increase VAT tax rates and decrease spending on national defence. Explain the likely effect of the level of economic activity (Real GDP), unemployment and the price level using the AD/AS model.
  5. In your notes draw an AS/AD model to explain the impacts of the events shown in each video. Be careful to fully label each diagram with any changes.

Friday, September 30, 2011

China Has Gas!! (my friend wrote this one)

China rations diesel as record oil hits supplies | Markets | ReutersQueues at China's pumps
In the fall of 2007 I spent  time in Shanghai, China. At the time, oil prices were hitting record levels world wide, leading to rising petrol prices for drivers in most places.  However, at the time,  I began witnesing an unusual site on my taxi rides into the city of Shanghai: as our taxi passed petrol station after petrol station, I observed dozens of blue trucks (the ubiquitous medium of transporting good from Shanghai’s factories to her ports) spilling out of gas station parking lots into the road, apparently queued, waiting for a spot at the pump. I had never seen such long lines at any of the petrol stations around Shanghai before, and I began to wonder as to the reasons for these crazy long lines!
Well, an article at the time helped solve the riddle of the long lines. As it turns out, there was a simple explanation rooted in the principles of supply and demand that any first semester AP or IB economics student would understand! The Chinese government had been forced to ration petrol (limiting the amount that a driver can buy at one go) due to the shortages resulting from the government’s price controls in the petrol market.
Truck drivers reported long queues at petrol stations along a national highway linking Fujian and Zhejiang provinces, with each truck getting 100 yuan ($13) worth of diesel, or around 20 litres, per visit at a state-run station and 40 litres at a private kiosk…
“What’s wrong with the oil market? Our drivers had to queue the whole night for only a small amount of fill, slowing the traffic by almost one day,” said Gao Meili, who manages a logistics company.
China is a major importer of oil. With an economy growing around 12% in 2007, much of the country’s growth depended on the availability of crude oil at reasonable prices, which China’s oil refining firms turn into diesel and petrol, needed to get Chinese manufactured products from factory to port and from port to overseas consumers.
The problem with the oil market in China, however, was that as “Chinese refiners cannot pass the souring crude costs on to consumers.” Oil is an input needed to make a finished product, diesel. As the price of oil rose in 2007 (it reached a record of $92 per barrel in October of that year), the resource costs to petrol and diesel producers also rose, shifting the supply of petrol and diesel to the left, putting upward pressure on the equilibrium price.   As a first semester AP or IB student knows, resource costs are a determinant of supply, and as oil (the main resource in the production of petrol and diesel) increased in price, the supply of these important commodities invariably decreased.
In a free market, a decrease in supply leads to an increase in price. Herein lies the answer to the riddle of the long lies at petrol stations in Shanghai: the Chinese petrol and diesel market is not a free market. The government plays an active role in controlling prices paid by consumers for the finished product refiners are producing, petrol fuel:
Beijing fears stoking already high inflation and rigidly caps pump fuel rates to shield users from a 50 percent rally in global oil so far this year.
As the costs to petrol and diesel producers rose in 2007, the government in Beijing took the side of consumers and forbade fuel producers from raising the price they charge consumers.  The Chinese government essentially imposed a price ceiling in the market for petrol. A price ceiling is a maximum price set by a government aimed at helping consumers by keeping essential commodities like fuel affordable. As we have learned this week in AP and IB Economics, price controls such as this end up hurting BOTH producers AND consumers, since they only lead to a dis-equilibrium in the market in which the quantity demanded for a product rises while the quantity supplied by firms falls. The shortage of petrol and diesel resulting from the government’s price control are the perfect explanation for the long lines of blue trucks and motor scooters at all the gas stations in Shanghai during October of 2007.
So why, exactly, does the government’s enforcement of a lower than equilibrium price result in such severe shortages that truck drivers are only allowed to pump 20 litres of petrol per visit and made to wait hours each time they need to refill? Below is a supply and demand diagram that illustrates the situation in the Chinese fuel market in 2007:

In the graph above, the supply of petrol has decreased due to the increasing cost of the main resource that goes into petrol, oil. This decrease in supply means petrol has become more scarce, and correspondingly the equilibrium price should rise. However, due to the government’s intervention in the petrol and diesel markets, the price was not allowed to rise and instead remained at the maximum price of Pc.
At the government-mandated maximum price of Pc, the quantity of fuel demanded by drivers far exceeds the quantity supplied by China’s petrol producers. The result is a shortage of petrol equal to Qd-Qs.
The government’s intention for keeping petrol prices low is clear: to make consumers happy and keep the costs of transportation among China’s manufacturers low so as to not risk a slow-down in economic growth in China. However, the net effect of the price controls is a loss of total welfare in the petrol market. Notice the colored areas in the graph above. These represent the effect on welfare (consumer and producer surplus) of the price control.
  • The total areas of the green, orange and grey shapes represent the total amount of consumer and producer surplus in the petrol market assuming there were NO price controls. At a price of Pe, the quantity demanded and the quantity supplied are equal (at Qe) and the consumer surplus and producer surplus are maximized. The market is efficient at a price of Pe. Neither shortages nor surpluses of petrol exist.
  • However, at a price of Pc (the maximum price set by the government), the amount of petrol actually produced and consumed in the market is only Qs. Clearly, those who are able to buy petrol are better off, because they paid a lower price than they would have to without the price ceiling. But notice that there is a huge shortage of fuel now; many people who are willing and able to buy petrol at Pc simply cannot get the quantity they demand, because firms are simply not producing enough!
  • The total consumer surplus changes to the area below the demand curve and above Pc, but only out to Qs. The green area represents the consumer surplus after the price control. It is not at all obvious whether or not consumers are actually better off with the price ceiling.
  • The total producer surplus clearly shrinks to the orange triangle below Pc and above the supply curve. Petrol producers are definitely worse off due to the government’s action.
  • So how is the market as a whole affected? The black triangle represents the net welfare loss of the government’s price control. Notice that with a price of Pe, the black triangle would be added to consumer and producer surplus, but with a disequilibrium in the market at Pc, the black triangle is welfare lost to society.
Price controls by government’s clearly have an intended purpose of helping either consumers (in the case of a maximum price or price ceiling) or producers (in the case of a minimum price or price floor).  But the effect is always predictable from an economist’s perspective. A price set by a government above or below the equilibrium price will always lead to either a shortage or a surplus of the product in question. In addition, there will always be a loss of total welfare resulting from price controls, meaning that society as a whole is worse off than it would be without government intervention.
Discussion Questions:
  1. Why has the supply of petrol decreased?
  2. With a fall in supply of a commodity like petrol, does the demand change, or the quantity demanded? What is the difference?
  3. Define “consumer surplus” and “producer surplus”. Why does a government’s control of prices reduce the total welfare of consumers and producers in a market like petrol?
  4. How would a government subsidy to petrol producers provide a more desirable solution to the high oil prices than the maximum price described in this post? In your notes, sketch a new market diagram for petrol and show the effects on supply, demand, price and quantity of a government subsidy to petrol producers. Does a subsidy create a loss of welfare? Why or why not?

Have Your Pasta and Eat It Too!!

Have a look at this article before reading the blog post below: Pasta prices rise after North Dakota loses million acres of wheat to heavy rain, flooding – Associated Press
Prices are determined by the relative scarcity of a good, service or productive resource. This fundamental lesson is one of the first things we learn in a high school economics class. Why are diamonds, which nobody really needs, so much more expensive than water, which everyone needs? The answer lies not in the relative demands for the two goods (clearly, water is far more demanded than diamonds), but rather the relationship between the relative demand and the supply. Between the two, diamonds are far more limited in supply than water, thus they are scarcer and accordingly more expensive.
This lesson applies not only to water and diamonds, but indeed to any product for which there is a market in which buyers and sellers engage in exchanges with one another. Commodities are goods for which there is a demand,  but for which the supply is standardized across all markets. For instance, bicycles are not a commodity, because there are hundreds of different types of bicycles, meaning it is not a standardized product. But steel, which is used to make bicycles, is a commodity since steel is fairly standard regardless of its ultimate use by manufacturers. Cookies are not a commodity, but wheat is, since wheat is a highly standardized ingredient used in the production of cookies.
Commodity prices, like the prices of anything, are determined in markets. Buyers are usually the manufactures of secondary products for which the commodities are an input. Since commodities are traded all over the world, there tends to be a common market price determined by the national or international supply and demand for the commodity. In recent weeks, one very important commodity has increased in scarcity, leading to an increase in the price for the finished product the commodity is used to produce.
Consumers are paying more for pasta after heavy spring rain and record flooding prevented planting on more than 1 million acres in one of the nation’s best durum wheat-growing areas.
North Dakota typically grows nearly three-fourths the nation’s durum, and its crop is prized for its golden color and high protein. Pasta makers say the semolina flour made from North Dakota durum produces noodles that are among the world’s best.
This year’s crop, however, is expected to be only about 24.6 million bushels, or about two-fifths of last year’s. Total U.S. production is pegged at 59 million bushels, a little more than half of last year’s and the least since 2006, according to the U.S. Department of Agriculture.
The cost of pasta jumped about 20 cents in the past few months to an average of about $1.48 a pound nationwide…
…North Dakota durum fetched about $15 a bushel this spring but has dropped to about $11, due to the lack of buying and selling.
Still, that’s about twice what it sold for at this time last year, she said…
“This is one of the few crops we have that can have such an immediate impact on the consumer,” Goehring said. “This year, they will experience higher pasta prices.”
The story above is one played out in countless markets for commodities (such as wheat) and the goods they are used to produce (pasta, in this case) all the time. Due to poor weather and a particularly wet spring, farmers were unable to plant as many of their fields with wheat as they have in the past. Therefore, the 2011 wheat harvest is less than it usually is, meaning the supply of wheat has decreased. However, since there has been no fundamental change to the demand for wheat (we still eat pasta!) the relative scarcity of wheat is greater than in the past. Demand remained constant, while supply fell, therefore the relative scarcity increased.
The value of anything is based on its relative scarcity. In product markets, like that for wheat, value is conveyed by the commodity’s price. As the article says, the price of wheat is currently selling at “about twice what it sold for at this time last year”. At the current price of $11 per bushel, we can assume that the price last year was $5.50. However, the price reached as high as $15 earlier in the summer, indicating that the reduced supply of 59 milliion bushels, which is “a little more than half of last years” (which we’ll assume was around 100 million bushels), caused the price to peak at $15 this year. All this is a complicated way of saying that as the output of wheat fell, wheat prices rose because demand remained constant.
Additionally, the price of the product for which wheat in an input also rose. Pasta prices have jumped “20 cents in the past few months” to $1.48. Since the price of wheat is a resource cost for pasta producers, higher wheat prices lead to a fall in the supply of pasta, making pasta more scarce and driving the price up for pasta consumers.
All this can be demonstrated graphically using simple supply and demand analysis.

Based on the figures in the graphs above, the responsiveness of wheat consumer (which are mostly pasta producers) to the rising price of wheat can be easily calculated. Price elasticity of demand (PED) is the measure of consumers’ sensitivity to price changes. It is measured by calculating the percentage change in quantity following a price change divided by the percentage change in price. The quantity demanded of wheat fell by 41%, while the price rose by 272%, meaning that the PED for wheat is 41/272, or 0.15. This is considered relatively inelastic since such a large price increase led to a relatively small fall in the quantity of wheat demanded.
It is likely that if wheat prices remain elevated throughout 2011, next spring farmers across the American Midwest will have a strong incentive to plant more acres of wheat than they have in years past. Assuming the weather conditions improve and the fields are dry enough to grow wheat, it would be expected that a year from now wheat prices will be much lower than they are today, as supply returns to or exceeds historical levels next year. High prices for wheat today have harmed pasta consumers, but in the long run everyone, both pasta producers and pasta consumers, will likely enjoy lower prices thanks to the high prices of today.
This is how the market system works. When resources are under-allocated towards a particular good, as they have been towards wheat in 2011, price rises in response to the good’s increased scarcity. But the higher prices incentivize producers to allocate more resources towards those goods’ production, and over time the supply increases once more, reducing its scarcity and bringing the price back down.
Discussion Questions:
  1. Why did wheat become more scarce in 2011, even though the demand for wheat did not change?
  2. Interpret the claim that “wheat consumers are relatively unresponsive to higher wheat prices”. Can you think of a reason why this is the case? Can you think of an example of a product for which consumers would likely be much more responsive to a change in the price?
  3. How does the high price of wheat and pasta in 2011 likely assure that a year from now, prices will be much lower than they are today, assuming there are not further problems with flooding in wheat growing areas?
  4. How do prices “allocate resources” in a market economy? What do you think would have happened to the number of acres farmers would plant in wheat next year if instead of the price doubling this summer, it had been half of what it was in previous years?

Monday, September 12, 2011

Welcome all new Econ students! Time to start thinking like economists

One of the questions I like to ask my student during the first week of class every year is “What is Economics?” The answers are always interesting to read, because unlike many other high school classes, Econ is one of those subjects students sometimes have no idea what it’s all about when they sign up for the class. Below are some of the definitions of “Economics” students shared in their first day survey this week:
  • “Economics is the study of money flow between either countries or individual companies.”
  • “My definition of Economics is the control of money by a person, organization or nation.”
  • “Economics is a complex system that determines and justifies global prices, currency values, and ultimately the success of a nation.”
  • “I’d say Economics is the study of how humans use resources including income, investments, taxes and the economy.”
  • “I think economics is the study of investments and money. Especially income and outcome, and taxes in the government.”
  • “The study of the distribution of wealth and how human beings tend to handle wealth.”
  • “A bunch of old men moaning about all of the potentially free lunch oppurtunities they had missed in their youth, passed off as the behaviour of markets.”
As you can see, most students do not yet have a clear definition of the subject in their heads when they start the course, which is perfectly understandable! So I thought I’d start the year off by sharing my definition of economics. Please read the following introduction to Economics then answer the discussion question that follows.
So what IS Economics, anyway? Well, look around you. What do you see? From within the Mainland Regional district, I see a massive bridge project in Somers Point. I can count eight yellow cranes swinging their arms hauling construction materials around their respective sites. I see farm markets, flower shops, farms, and gardens. I see a church steeples and businesses all around our school. I can just see the tops of cars racing along the Parkway to and from towns and cities all along south and north Jersey.
Now ask yourself, how did things get to be this way? Why are new bridges going up in the midst of America’s deepest recession in decades? Why are farmers and gardeners able to continue on when condos and single family houses are selling for half a million dollars just beyond their fields? Why are the Pinelands and parks still standing even as development has encroached into most of the region’s  forests and natural ecosystems? How do normal people make enough money to live comfortably in this expensive country? Where do the things we buy come from? Who built this computer I’m typing on and what will I be doing for a living in twenty years?
One of my favorite quotes that to me sums up what economics is all about comes not from an economist, but from the civil rights leader Martin Luther King. In 1967 King wrote:
Did you ever stop to think that you can’t leave for your job in the morning without being dependent on most of the world? You get up in the morning and go to the bathroom and reach over for the sponge, and that’s handed to you by a Pacific islander. You reach for a bar of soap, and that’s given to you at the hands of a Frenchman. And then you go into the kitchen to drink your coffee for the morning, and that’s poured into your cup by a South American. And maybe you want tea: that’s poured into your cup by a Chinese. Or maybe you’re desirous of having cocoa for breakfast, and that’s poured into your cup by a West African. And then you reach over for your toast, and that’s given to you at the hands of an English-speaking farmer, not to mention the baker. And before you finish eating breakfast in the morning, you’ve depended on more than half the world. This is the way our universe is structured, this is its interrelated quality.
Economics is about all the questions I posed above and it’s about all the interactions King describes. Economics is about solving one major problem faced by all human societies going back thousands of years. Economics is about the problem of scarcity. Scarcity is the natural phenomenon arising from the fact that all the world’s resources are physically limited in quantity.
Limited resources alone would not pose a problem if it were not for one characteristics of human beings that makes us truly unique in the animal kingdom. The fact that we have desires and wants beyond our basic physical needs. In the face of humans’ practically unlimited desires and wants, the limited nature of the earth’s limited natural resources gives rise to conflicts regarding the allocation of those resources. Economics is the social science that deals with the allocation of earth’s scarce resources among the competing wants and needs of society. Economists provides society with various tools and techniques for efficiently allocating our scarce resources.
Discussion question:
  1. Scarcity of resources has given rise to countless conflicts among and between societies throughout history. Identify one conflict from the past or present that you think the problem of scarcity gave rise to.
  2. Some say that many of the environmental problems our world faces to day can be solved by economics. If that’s the case, then they must have to do with scarcity. Identify one environmental problem and explain how it relates to scarcity.
  3. Time is one of the scarcest resources. Explain how the decisions you make regarding your limited time in and out of school can be considered economic decisions.

Friday, March 11, 2011

Brief overview of several Middle-Eastern countries---Yes, I am facsinated with population pyramids--they say SO MUCH!

From the NY TIMES.  A brief overview of relevant Middle Eastern countries on the brink.  Of particular interest to me are the population pyramids to the right...The demographics will drive change in that area for several decades. SO YOUNG!!!!


Apple provides workers a safety net in China---but it is not the kind of safety net you are thinking about...I guess there IS an APP for that!

Source: Wired
 ""It’s hard not to look at the nets. Every building is skirted in them. They drape every precipice, steel poles jutting out 20 feet above the sidewalk, loosely tangled like volleyball nets in winter.

The nets went up in May, after the 11th jumper in less than a year died here. They carried a message: You can throw yourself off any building you like, as long as it isn’t one of these. And they seem to have worked. Since they were installed, the suicide rate has slowed to a trickle.""
Apple outsources the manufacture/assembly of all of its marquee products to a Chinese company called FOXCONN...It has a HUGE facility and employs about 1 million people. They have a history of stress related suicides, apparently from jumping off the buildings...I guess there IS an APP for that!!!!

See the projected path of the Tsunami waves from the earthquake in Japan...Quite amazing!

Thursday, March 10, 2011

Wednesday, March 9, 2011

Nice job, Congress...Can't wait til next month---Record Monthly Deficit...$223 Billion...

Government posts biggest monthly deficit ever

The federal government posted its largest monthly deficit in history in February at $223 billion, according to preliminary numbers the Congressional Budget Office released Monday morning.


That figure tops last February’s record of $220.9 billion, and marks the 29th straight month the government has run in the red — a modern record. The last time the federal government posted even a monthly surplus was September 2008, just before the financial collapse.

Last month’s federal deficit is nearly four times as large as the spending cuts House Republicans have passed in their spending bill, and is more than 30 times the size of Senate Democrats’ opening bid of $6 billion.

Senators are slated to vote this week on those two proposals — both of which are expected to fail — and then all sides will go back to the negotiating table to try to work out a final deal.

It is the entitlement programs and interest payments, Stupid...

That is a play on the words of Pres. Clinton's campaign slogan of 91'. Entitlement programs, primarily Social Security and Medicare, and interest payments on the national debt, will eventually consume ALL of the projected revenues to the Federal Government.  This is NOT including paying for other things, like National Defense and ALL other discretionary spending the Federal Government does.  We are going to need a bigger boat---load of tax money to pay for this.  Notice the year it is projected students---right in your early 30's. The onset of your peak earning years. You better do REAL well, because it is going to be costly..


The demise of the one dollar bill would be a good thing---not the value, but the paper it is printed on...It is time to go to coinage.

Source: Carpe Diem
Source:  Carpe Diem for this posting....
The chart above is based on data from the Dollar Coin Alliance (DCA), a coalition of small businesses, budget watchdogs, trade associations, and private companies advocating that the U.S. transition to the dollar coin. The DCA is asking Congress to eliminate the dollar bill in favor of the dollar coin to save billions annually in taxpayer money. According to the DCA:
1. Each year approximately 3.2 billion $1 bills are removed from circulation due to wear and tear. They are not recyclable, so they are shredded and most are deposited in landfills. Dollar coins have a lifespan of 30 years or more, while $1 notes last approximately 2-3 years. A $1 coin that is produced for less than 16¢ would replace 17 bills that would have to be printed for a cost of 47¢.
2. The private sector experiences even greater cost savings and increased revenues from $1 coins. Jammed $1 bills in vending machines cost the industry $1 billion in annual repair costs and lost sales. According to the transit industry, it costs six times more to process $1 bills than $1 coins.
3. Other countries have already recognized the cost savings and benefits of the dollar coin, including Canada, the European Union, and Japan. When Canada transitioned to a dollar coin 25 years ago, the government realized savings more than ten times initial estimates.
4. The United States has one of the smallest denominations of paper currency among the major economies of the world (G-8 Countries). The $1 bill is worth less than any of these other bills except for the Russian Ruble (see chart above).
5. According to a January 2011 poll, Americans favor the transition to a dollar coin by a two-to-one margin once the potential government savings are explained.

The Happiest Person in America has been located! A very unlikely bundle of characteristics...

The happiest person in America has been located!! Sadly, it is not me, but could be...

The Happiest Man in America Goes Viral

The New York Times asked Gallup to come up with a statistical composite for the happiest person in America, based on the characteristics that most closely correlated with happiness in 2010. Men, for example, tend to be happier than women, older people are happier than middle-aged people, and so on. Gallup’s answer: he’s a tall, Asian-American, observant Jew who is at least 65 and married, has children, lives in Hawaii, runs his own business and has a household income of more than $120,000 a year. A few phone calls later and ...
Meet Alvin Wong. He is a 5-foot-10, 69-year-old, Chinese-American, Kosher-observing Jew, who’s married with children and lives in Honolulu. He runs his own health care management business and earns more than $120,000 a year.


Help Wanted: Economist needed by Somali Pirates to help with peak load ransom pricing. Experience piloting deep sea cargo ships is a plus...

Hostage Oversupply in Somalia?  Pirates Negotiate Better Deals to Free Up Space


Somali pirates may have reached their limit, at least for now. Security agencies have suggested that Somali pirates are willing to negotiate lower ransoms to release ships they have seized -- because they are running out of room.


Somali pirates have made large swathes of the Indian Ocean a no-go area, but lately they've become victims of their own success. Security agencies report that pirate groups are more willing to negotiate the release of captured vessels lately -- in large part, experts believe, because their ports at Haradheere, Eyl and Hobyo are choked up with ships.


The pirates are reportedly looking for quicker deals, and seem willing to accept lower ransoms, if it means the ships can be moved on...

If you take a shower, you WILL relate with this graphic...

Source CP

Monday, March 7, 2011

A VERY nice interactive graphic comparing state tax rates on various items---very informative!

A terrific interactive to compare states by some vital statistics...I always love to see the comparisons with taxes. It can explain alot in terms of the retail price of various goods. 

Free Tax Filing at TurboTax.com

Is King Dollar Dead? Nice graphic showing the decline of the dollar as the currency of record for international transactions.

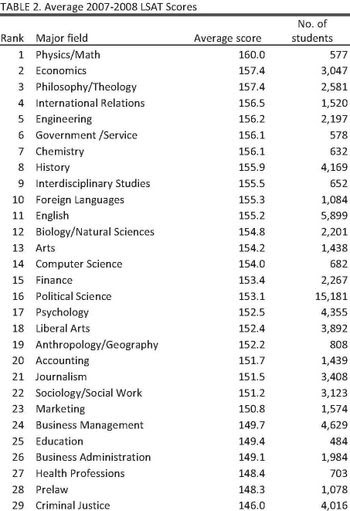
Physics/Math, Economics Majors Ace the LSAT; Criminal Justice, Prelaw Majors Bomb the Test

Want to increase your chances of getting a high score on the test required to get into Law School?  Well, if you don't like physics or math, then Economics appears to be the major that best prepares you...LSAT tests your ability to think outside the box and economics sure does that...
""Michael Nieswiadomy (University of North Texas, Department of Economics) has posted LSAT Scores of Economics Majors: The 2008-2009 Class Update on SSRN. Here is the abstract:
Using 1994-1995 and 2002-2003 data, Nieswiadomy (1998, 2006) found that economics majors scored well on the LSAT. These results are frequently posted on university web sites by Economics and other departments. This note, which updates the prior studies using current 2007-2008 data for the 2008-2009 class of students entering law school, finds that Economics majors still perform at or near the top of all majors taking the test. Economics majors (LSAT score of 157.4) are tied for first (with Philosophy) of the 12 largest disciplines (those with more than 1,900 students entering law school). Economics is tied for second (with Philosophy/Religion (157.4)) behind Physics/Math (160.0) in a set of 29 discipline groupings that are created to yield at least 450 students with similar majors.""
Source HERE

How much does crude oil factor into the price of gasoline? Two nice graphics break it down for you...We GOTTA get off this stuff!!

These two graphics show the significance of crude oil as an input into the productlon of a gallon of gasoline...We GOTTA get off this stuff...
Source of both graphs HERE:


My Tips for graduating Seniors as they prepare for their first semester of college---the advice is free and worth what you pay for it...

Below are 5 basic recommendations I give to graduating Seniors that I believe will help them succeed in their first semester of college. They are by no means inclusive of everything that they should do, but I believe can form an excellent foudation for success.  Whether you are shy and tend to cocoon in your dorm room and not get out, or you have the opposite problem and are too social and don't stay focused enough, I think these can help you.  It is free advice and worth what you paid for it...

1. The first month of school join the "___Society" or club that goes with your major...i.e. Economics Society, Math Society, Computer Science Society, etc.  Find out where and when they meet. Go to the meetings and participate or just sit in the back of the room and absorb.  It is important to make connections with your "own kind", meaning people with the same academic interest as you do.  You will meet peers who are ahead of you and you can be important contacts that may pay off for you later.  At the minimum, you may meet a friend or two.  Also, the professors in your department who may attend these meetings will at least see your face from time to time. This will help you as you progress in your department. You never know what opportunities may open up for you.  If the professors see you as interested and ambitious, they will help you out with opportunities that are not well publicized or utilized. 

2.  Join ANOTHER group that is service/educational orientated and not connected to your major. Most colleges have a zillion of these clubs/groups (This also includes getting involved with a church, if that is your thing).  This will expand your circle of friends and acquaintances.  If service is not your thing, then intramural sports or some other activity will suffice--just get OUT of your dorm room!

3.  Find or start a QUALITY study group.  Many times this starts the first day of class.  Some students take the initiative and make it known they are starting one. Be careful of the ones you join! Be an active participant and not a distraction. If you get into a study group and they spend the first 30 minutes goofing off, then find another one.  Staying on top of your studies is the most important task you have your first semester.

4. Treat college like a job. Do it from 9 to 5 (or 8 to 4, or 10 to 6, etc) 5 days a week.  This includes class time. Find a place where you can focus with no distractions.  DO NOT GO BACK TO YOUR DORM ROOM!  For some students, this works, but I believe for most this is a BAD move--naps are too easy and the internet/gaming is too close at hand.  Take an hour lunch break.  Don't get into the habit of saying "hey, class just started, I have plenty of time in the semester to get things done".  Stay current on your work and even get ahead.  What is wrong with going above and beyond in your class and supplementing with additional reading/research in the class you are taking?  It IS called "education", after all.  If you can maintain this discipline, I believe you will not have to stay up ANY night OR weekends to study. Of course, as with any "job", there may be exceptions when you have to do more at times.  You friends will wonder why you never seem to study or cram---you did it while they were napping or otherwise wasting time. 

5.  DO NOT PROCRASTINATE in getting help with a class you are stuggling with! All colleges have resources to help you keep up, i.e. math labs, orgainized tutorial sessions, help with finding tutors, etc. All professors have Teaching Assistants (TA's) whose primary job is to help students with homework or tutorials. Locate your TA immediately and use them.  Most professors are available too, some more than others.  Don't be shy about this! You are paying big bucks for your education and this is not high school any more. Where I have to call your parents and give you a gazillion chances, college is different. You are responsible for yourself 100%. 

Remember, these are only suggestions.  I understand there are exceptions and "what if's".  Do one, two, three or all five.  In any combination I hope this will be helpful as you start from scratch as a Freshman again...

think Qaddafi just either became a Libertarian or joined the TEA Party...I am having a political identity crisis today...


Source: ME!
 As a quasi-Libertarian (but not a member of the TEA party) I do not welcome this development, but as someone with a sense of humor, I guess I have to welcome him to the club as a tax-cutter... :)..Also, did he just declare "Mission Accomplished"?  Guess he does not read the papers either...

Qaddafi's Solution To His Crisis: Tax Cuts!


Libyan state TV announces wide-ranging tax cuts. It says:

""The general public committee has decided to reduce customs on basic commodities to zero per cent and to reduce customs on all other commodities to only five per cent. It also decided to remove all consumption and production taxes. The new changes were made on the occasion of the victory of our great people over the terrorist gangs.""

Nice video on the state of US Manufacturing and the failure of the US to adapt to the changing nature of work in this industry.

HT: Carpe Diem....A nice, short video on the changing face of American manufacturing.  The popular focus from the media and politicians is the off-shoring of jobs to foreign destinations. True that. However, the elephant in the room of modern day manufacturing is the way work is done in today's factories in the US--it is high tech and takes different skills relative to old-line manufacturing jobs.  They require more education and less phyiscal prowess.  The second video is a production of "The Onion" and how trying to save old manufacturing jobs is, well, not in the interests of a 21st century US. (Warning: Some bad language in that video!!)


Obama Promises To Stop America's Shitty Jobs From Going Overseas

Tuesday, March 1, 2011

How to get rich nickel-and-diming...No, REALLY! Get rich with nickels and dimes!!


If a nickel has 7 cents worth of metals and you melted it down and sold it at that maket value, you would have a rate of return of 40%! (.07 minus .05 divided my .05 times 100).  If you found some pre-1965 dimes, at the rate quoted below, you would do very well.  Excuse me while I flip the cushions of my sofa over...I will be right back...

Hoarding Nickels, Collecting stamps? Is this the best investment for America's working poor?

""US five cent coins contain over 7 cents worth of raw material as of this afternoon, mostly copper and of course, nickel. If there is inflation, the prices of metal will increase, and the coin will have 8, 9, 10 cents worth of metal. Pre-1965 dimes contain over $2.42 of metal today, while pre-1965 quarters have over $6 worth of metal. (http://www.coinflation.com/)
If there is deflation, the coins are still currency at face value. They will always be nickels. There is also no transaction cost for "buying" these coins. Just save them as you get them from change, or pick up $2 rolls at local banks. ""

What do we export? What do we import? Who are our biggest trading partners? So many questions...the answers are just a click away...

A couple of useful graphics on International trade. The first one is a brief look at our top goods that we exported and imported in 2010.  The elephant in the room is our import of oil.  The only good in double digits by a significant margin.

Source: WSJ

The second one shows the changes in trade patterns with major trading partners since 1990...The change in TOTAL trade (exports PLUS imports) with China has been remarkable in just 20 years.  However, the elephant in the room with this metric is the excess of imports over exports. 

Monday, February 28, 2011

No serious budget cutting will take place unless entitlement programs are put on the table...No wait, entitlement programs ARE the table!

The Economist
 
Add together Medicare, Medicaid, Social Security and Net Interest and you see our problem.

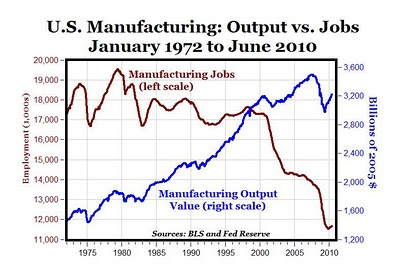
In one photo we can see the "problem" in manufacturing in the US...Output is up but employment is down in that sector...

This is a photo that accompanies an article about a Hyundai plant in Alabama.  In the battle for the "soul" of manufacturing, it seems technology has won---At least in the auto industry.  I can spot only one worker! The graph below shows that while manufacturing output is increasing, employment in manufacturing is declining.  Not enough attention is paid to this issue.  How much of the manufacturing job loss is for this reason and not off-shoring? Is it much different for a person to lose a job to a machine than to some "foreign worker"? On the one hand we want to tax/punish businesses for sending production line jobs overseas but, on the other hand, we give tax CREDITS to domestic businesses to purchase technology that will, well, eliminate jobs on the production line...Hmm...That is two postings from me today on Irony...
Source NY TIMES


Do you think gas prices are high? Nice graphic showing what other rich countries pay for gas...

This graphic shows the difference in gasoline prices among various "rich" countries. It is measured in dollars per litre. One litre is a little more than 1/4 of a gallon, hence there are a little less than 4 litres in a gallon.  Ignore the actual scale.  It is only important to look at the US cost of gasoline on the bar graph RELATIVE to the other countries.   Look at the bars. The gray-ish part of the bar represents the amount of the tax as a proportion of the price of gasoline. I am assuming the lighter blue bar represents the actual cost of gasoline.Notice the blue bars are mostly the same length, which means in most places the actual cost of gasoline is about the same.  The big difference in the total price is the tax that is levied.   Gas in the US is taxed at a much lower rate.  Gas is taxed at the state level and the Federal level in the US. The Federal portion is $18.4 cents and the State (Texas) is $.20 cents.  Some States it is less, most it is more.  So Texans pay $38.4 cents for every gallon pumped.  Are you surprised how much other countries pay in gas taxes?  It make the price very expensive in many European countries.  Why do you suppose that is so?  Good answers earn extra credit!!

The Federal Budget buy the numbers....and what does a Trillion Dollars look like??


WSJ
 The number "trillions" is the new norm. Whether it is revenues, spending or worse--budget deficits.  The graphic below represents ONE Trillion dollars ($1,000,000,000,000)  in $10,000 bundles each containing one hundred $100 dollar bills. This years budget deficit is projected to be $1.1 Trillion (probably going to be much more). Notice the average size man in the lower left hand corner.

Source HERE

I guess it makes sense...They have so many pieces of green paper with several presidents pictures on them, who better to make the statues?


At Smithsonian, Americana 'Made in China'

Tens of millions flock to the Smithsonian museums in Washington each year to see Americana -- everything from Abraham Lincoln's top hat to Archie Bunker's chair.

Take the miniature sculptures of presidents sold at the National Museum of American History, located right on the Mall in the nation's capital.

From the busts of George Washington to Barack Obama, they were made in China.

Last month Sen. Bernie Sanders, I-VT, was so outraged by the situation that he fired off a letter demanding that the museum sell products made in the USA.

We have our own bonds of oppression that we need to break...

Pres. Clinton makes the right call on Ethanol, but does it get him in trouble with Mrs Clinton???

President Clinton makes a statement that, I assume, is none too pleasing to corn farmers and the ethanol lobby.  Considering the road to the White House starts in Iowa, a major corn growing state, I wonder if he cleared this through Mrs. Clinton or gave much thought to her future political career...Guessin' not...However, it IS encouraging to see a politician come out against this awful policy (although it was lukewarm).  When you don't have much at stake, it is much easier to be honest, I suppose.

Clinton: Too Much Ethanol Could Lead to Food Riots

Former President Bill Clinton on Thursday warned farmers that using too much corn for ethanol fuel could lead to higher food prices and riots in poor countries.


Clinton told farmers and Agriculture Department employees that he believes producing biofuels such as corn-based ethanol is important for reducing U.S. dependence on foreign oil. But, he said, farmers should look beyond domestic production and consider the needs of developing countries.


"We know that the way we produce and consume energy has to change, yet for farmers there are no simple answers," he said. "There is a way for us to do this and to do it right."

Clinton's foundation has worked to develop agribusiness in African countries such as Malawi and Rwanda. He said the United States needs to look at the long term, global effects of its farm policy.


"I think the best thing to say is we have to become energy independent, but we don't want to do it at the cost of food riots," Clinton said.